

The 200-day Moving Average and the Market Trend
The 200-day Moving Average and the Market Trend
For Position and Long-term trading


The 200 MA
The 200-day Moving Average is a technical indicator that helps traders identify long-term trends and determine support and resistance levels. This moving average displays a line on the chart, and it is calculated by taking the average closing price of a market over the past 200 days.
Identifying the trend of the market
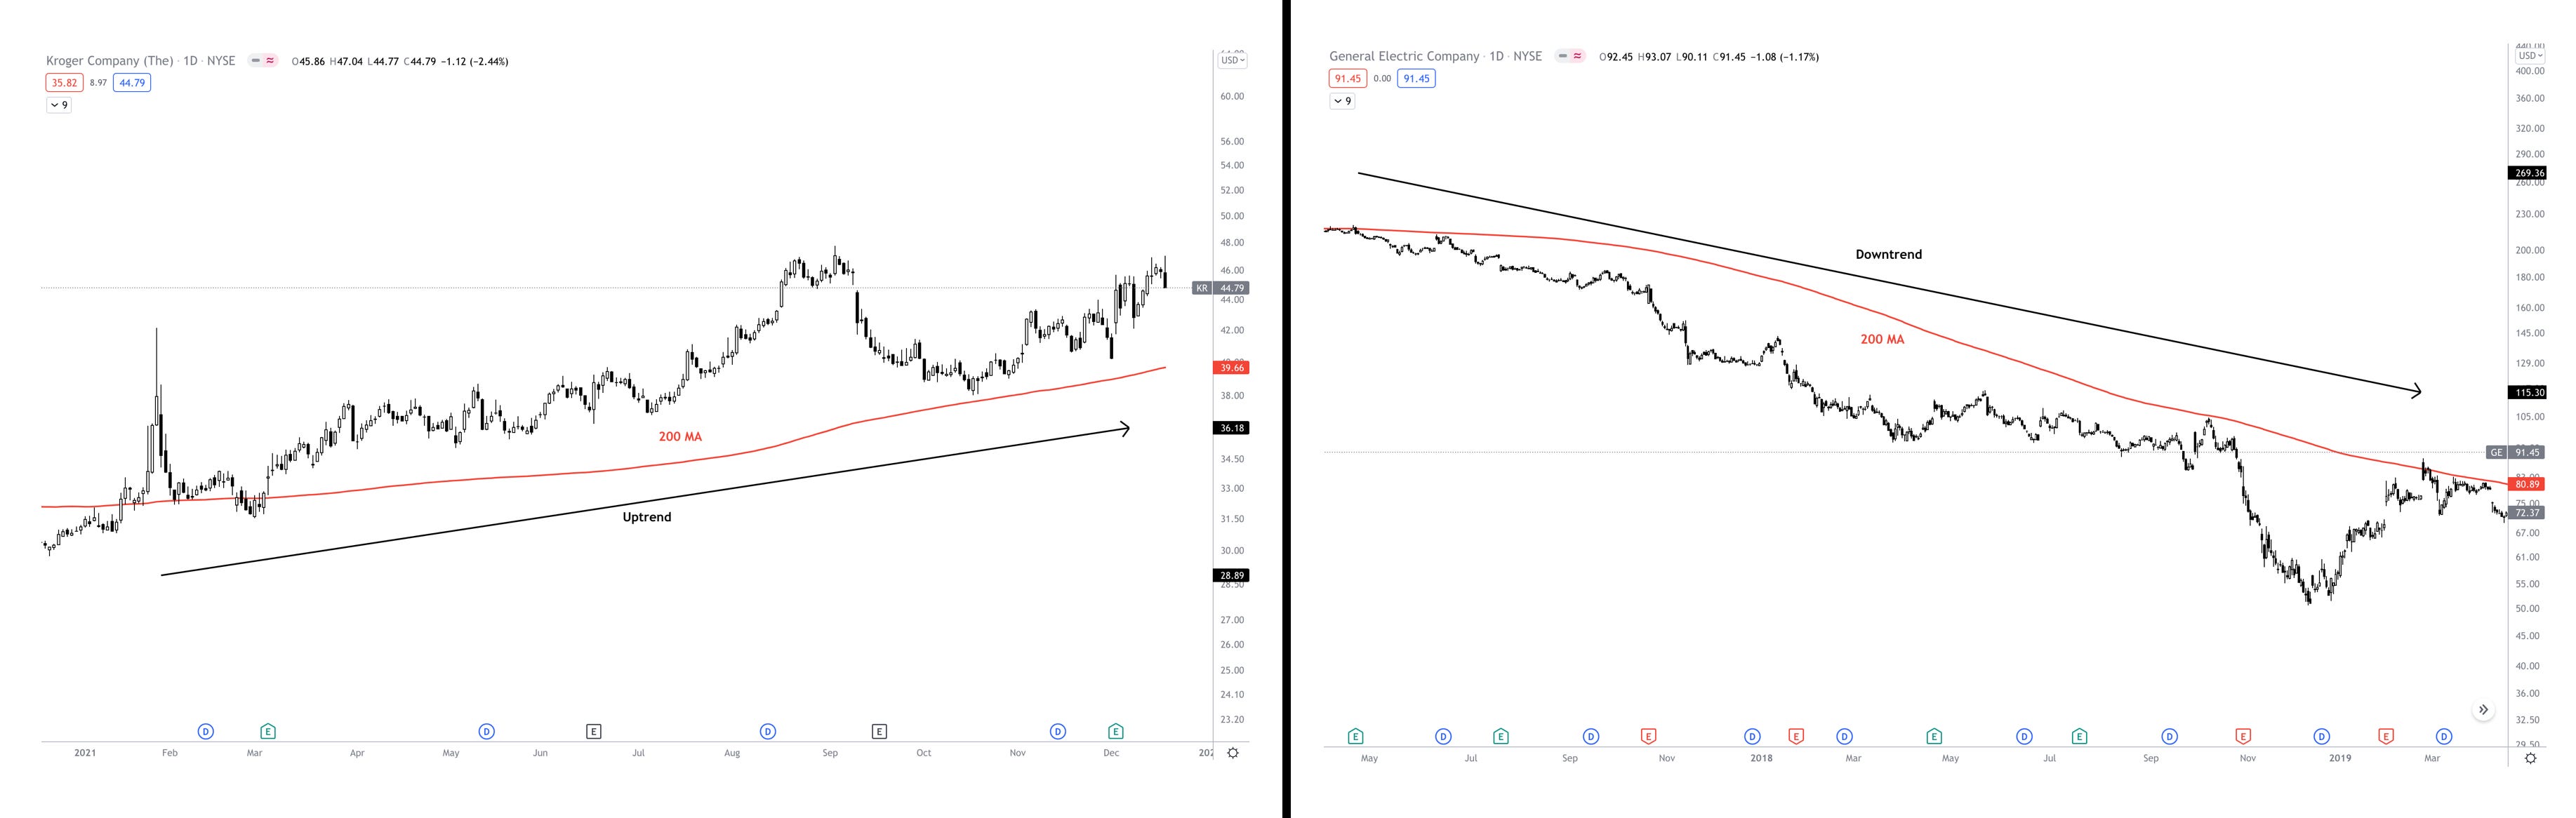
Before entering a trade, traders need to identify the market trend. An excellent way to determine the market trend is using the 200 MA on the daily chart. The 200-day moving average is a technical indicator that can identify long-term trends. If the price has consistently traded above the 200 MA in the daily chart, you can interpret that the stock is on an uptrend. When the price is consistently trading below 200 MA, the market is in a downtrend.
The 200 MA to determine Support and Resistance.
Support
When the price moves near or touches the 200 MA and then bounces off of it, then it’s a signal that the market will continue its uptrend. In this case, the 200 MA acts as support. When this situation happens, traders look for opportunities to long the market.

Resistance
When the price crosses down the 200 MA line and is consistently trading below it, it indicates that a change in the trend direction has probably begun, and the market is heading to a downtrend. When this happens, traders look for opportunities to short the market.
When the price is trading below 200 MA, the 200 MA acts as resistance. If the price approaches the 200 MA and fails to trade above it consistently, this is a signal that the market will continue its downtrend.

Disclaimer: The nature of trading and investing in any assets is risky and can lead to capital losses. Our content is meant for informational purposes and should never be considered as financial advice.
Charts drawn using TradingView
Follow me on Twitter