$APO - Ascending Triangle Chart Pattern
$APO - Apollo Global Management, Inc. engages in the provision of alternative investment management services. It operates through Credit, Private Equity, and Real Assets segments.
Market Capitalization 25.176B
Ownership Summary: 83.61% Institutional Ownership
Sector: Finance
TECHNICAL ANALYSIS
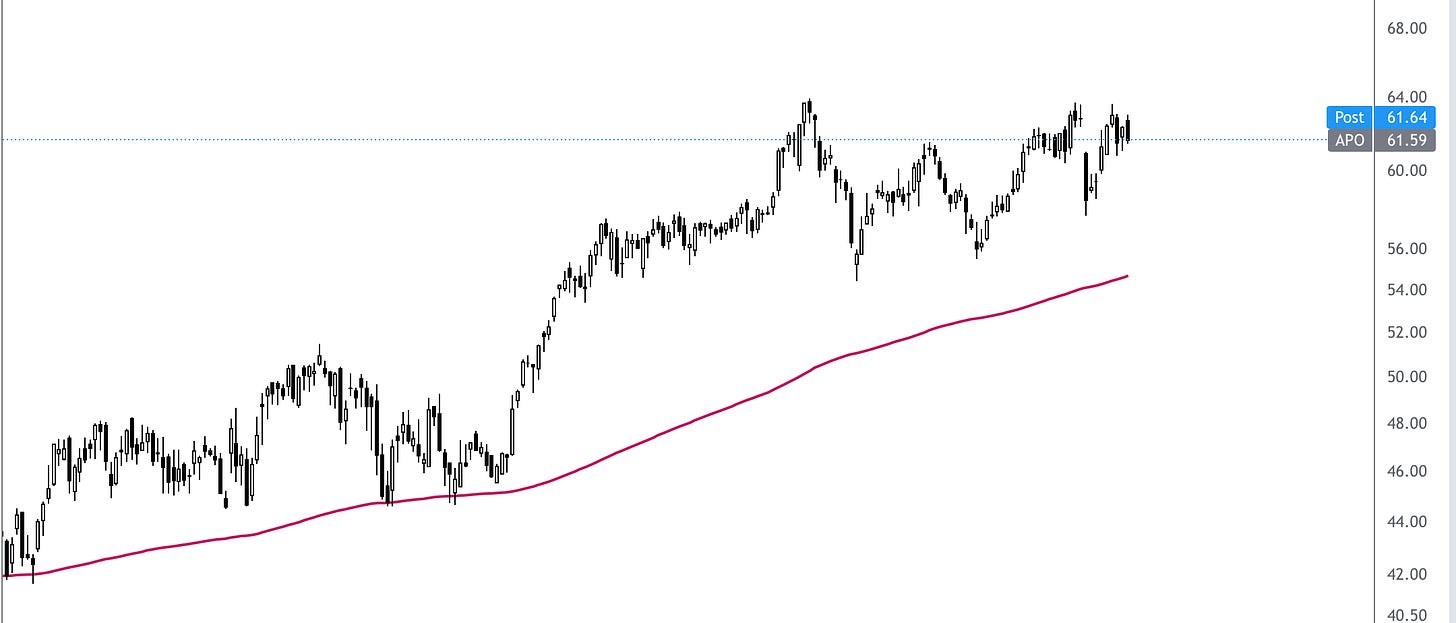
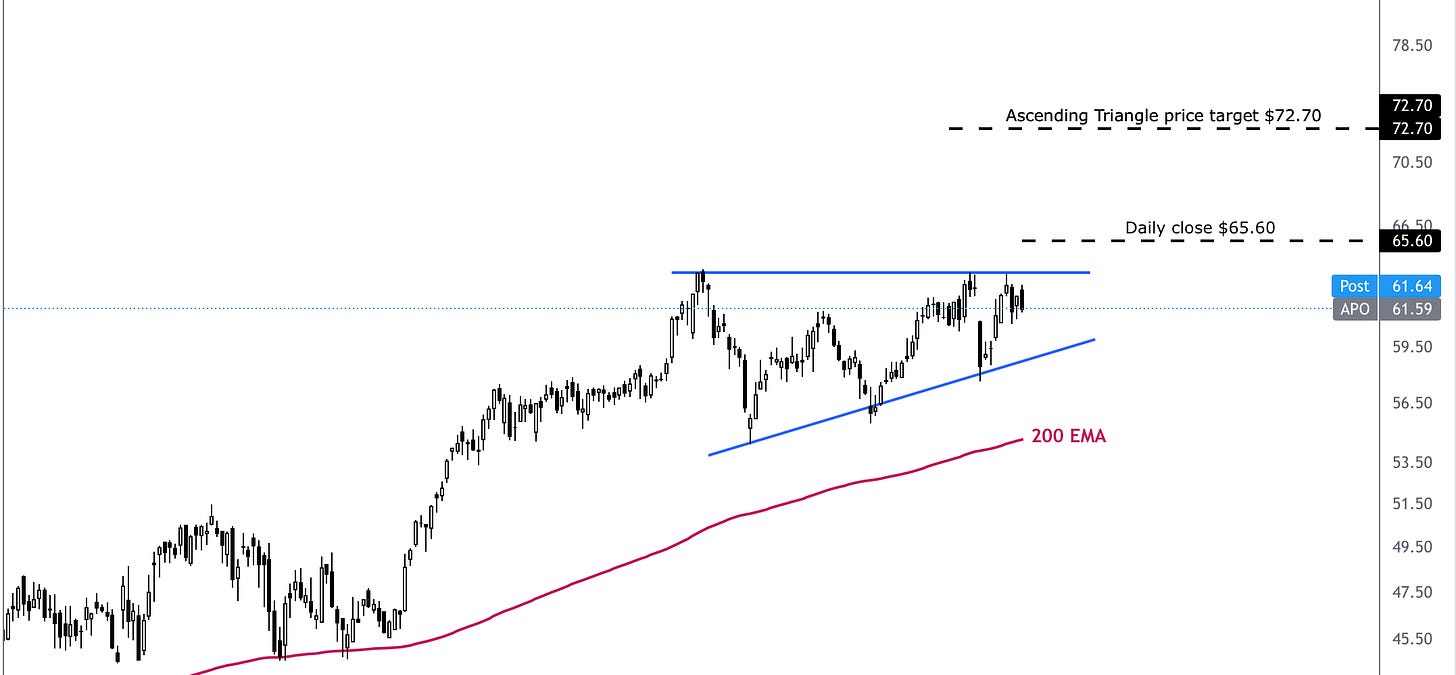
The price chart has formed an Ascending Triangle pattern since July2021, finding strong resistance at the $63.70 price level. The current price is above the 200 EMA. A daily close of $65.50 will confirm the breakout from the ascending triangle with a possible price target of $72.70.


